First of all, sorry for the lack of news on this blog. But I come here to bring you some exciting news!
DashBuilder project is active and innovating at a fast pace! But how can I keep you with the new features?
First, we have a new blog home blog.kie.org. From now on, this blog is decommissioned, and we will publish all the DashBuilder news and blog posts on the KIE blog.
You can also check out this blog post to see a summary of the most exciting DashBuilder new features; follow the Getting Started Guide or check our codebase directly.
A common feature users usually ask for is the ability to customize the look&feel of their metric displayers. In order to cope with those kind of scenarios, UF Dashbuilder provides an editor which allows for the edition and customization of the metric HTML code. The perspective editor's Displayer Component is in charge of providing such functionality. In order to start the edition process just drag & drop a Displayer Component from the component sidebar on the right:
Once opened, select the Metric type from the types on the left. The system provides four predefined templates. On the center of the screen, a preview of the metric is shown along with the HTML and Javascript options, both give access to the metric's source code.
From the HTML tab, it is possible to provide a custom template using the HTML language. Some metric related variables can be injected in the template as well just by clicking on the upper right icon and selecting from the list of available variables. Also both Bootstrap 3and PatternFly are supported for CSS styling.
From the Javascript tab users can provide a JS snippet which is executed every time the metric is displayed. Likewise the HTML tab, it is possible to reference some context variables as well as DOM elements from the HTML template. Altogether it allows for the implementation of nice features like for example: changing the color of the metric if its value exceeds a given threshold, apply a custom format to the value, etc.
The next video (do not forget to select HD) shows how to create and customize a new metric using the features described above. Enjoy!
The implementation of the security management features in UF Dashbuilder is done (see the related ticket in JIRA). This is a major step towards the full migration of the old Dashbuilder tooling to GWT/Uberfire. The following video is a preview of the new security management screen in the UF Dashbuilder webapp (don't forget to select full HD for a better display).
This article describes how administrator users can manage the application's users, groups and permissions using an intuitive and friendly user interface in order to configure who can access the different resources and features available. The security management capabilities presented exceed by far the ones provided by the old Dashbuilder.
Basic concepts
In order to understand the new security management module, a few core concepts need to be introduced first.
Roles vs Groups
Users can be assigned with more than one role and/or group. It is always mandatory to assign at least one role to the user, otherwise he/she won’t be able to login. Roles are defined at application server level and they are part of the webapp’s web.xml descriptor. On the other hand, groups are a more flexible concept, since they can be defined at runtime.
Permissions
A permission is basically something the user can do within the application. Usually, an action related to a specific resource. For instance:
View a perspective
Save a project
View a repository
Delete a dashboard
A permission can be granted or denied and it can be global or resource specific. For instance:
Global: “Create new perspectives”
Specific: “View the home perspective”
As you can see, a permission is a "resource + action" pair. In the concrete case of a perspective we have: read, update, delete and create as the available actions. That means that there are four possible permissions that could be granted for perspectives.
Permissions do not necessarily need to be tied to a resource. Sometimes it is also necessary to protect access to specific features, like for instance "generate a sales report". That means, permissions can be used not only to protect access to resources but also to custom features within the application.
Authorization policy
The set of permissions assigned to every role and/or group is called the authorization (or security) policy. Every application contains a single security policy which is used every time the system checks a permission.
The authorization policy file is stored in a file called WEB-INF/classes/security-policy.properties under the application's WAR structure.
NOTE: If no policy is defined then the authorization management features are disabled and the application behaves as if all the resources & features were granted by default.
Here is an example of a security policy file:
# Role "admin" role.admin.permission.perspective.read=true role.admin.permission.perspective.read.Dashboard=false
# Role "user" role.user.permission.perspective.read=false role.user.permission.perspective.read.Home=true role.user.permission.perspective.read.Dashboard=true
Every entry defines a single permission which is assigned to a role/group. On application start up, the policy file is loaded and stored into memory.
Security provider
A security environment is usually provided by the use of a realm. Realms are used to restrict access to the different application's resources. So realms contains the information about the users, groups, roles, permissions and any other related information.
In most typical scenarios the application's security is delegated to the container's security mechanism, which consumes a given realm at same time. It's important to consider that there exist several realm implementations, for example Wildfly provides a realm based on the application-users.properties/application-roles.properties files, Tomcat provides a realm based on the tomcat-users.xml file, etc.
So there is no single security realm to rely on, it can be different in each installation.
Due to the potential different security environments that have to be supported, the security module provides a well defined API with some default built-in security providers.
A security provider is the formal name given to a concrete user and group management service implementation for a given realm.
The user & group management features available will depend on the security provider configured.
If the built-in providers do not fit with the application's security realm, it is easy to build and register your own provider.
Installation and setup
At the time of this writing, the application provides two pre-installed security providers:
Wildfly 10 / EAP 7 - Both distributions use the Wildfly security provider configured for the use of the default realm files application-users.properties and application-roles.properties
Tomcat - It uses the Tomcat security provider configured for the use of the default realm file tomcat-users.xml
Please, read each provider's documentation in order to apply the concrete settings for the target deployment environment.
On the other hand, when either using a custom security provider or using one of the availables, consider the following installation options:
Enable the security management feature on an existing WAR distribution
Setup and installation in an existing or new project
NOTE: If no security provider is installed, there will be no available user interface for managing the security realm.
Once a security provider is installed and setup, the user and group management features are automatically enabled in the security management UI (see the "Usage" section below).
Enabling user & group management
Given an existing WAR distribution, follow these steps in order to install and enable the user & group management features:
Ensure the following libraries are present on WEB-INF/lib:
If the provider requires additional libraries, copy them as well
Replace the whole content of the WEB-INF/classes/security-management.properties file, or if not present, create it. The settings present on this file depend on the concrete implementation used.
If deploying on Wildfly or EAP, check if the WEB-INF/jboss-deployment-structure.xml requires any update.
The user & groups management features can be disabled, and thus no services or user interface will be available, by means of either:
Uninstalling the security provider from the application. When no concrete security provider is installed, the user and group management features will be disabled and no services or user interface will be displayed to the user.
Removing or commenting the security management configuration file. Removing or commenting all the lines in the configuration file located at WEB-INF/classes/security-management.properties is another way to disable the user and group management features.
Usage
The Security Management perspective is available under the Administration section in the top menu bar.
The next screenshot shows how this new perspective looks:
This perspective supports:
List all the roles, groups and users available
Create & delete users and groups
Edit users, assign roles or groups, and change user properties
Edit both roles & groups security settings, which include:
The home perspective a user will be directed to after login
The permissions granted or denied to the different workbench resources and features available
All of the above together provides a complete users and groups management subsystem as well as a permission configuration UI for protecting access to specific resources or features.
The next sections provide a deep insight into all these features.
NOTE: The user and group management related features can be entirely disabled. See the previous section
"Disabling user & group management". If that's the case then both the Groups and Users tabs will remain hidden from the user.
User management
By selecting the Users tab in the left sidebar, the application shows all the users present by default on the application's security realm:
Searching for users
In addition to listing all the users, search is also allowed. When specifying the search pattern in the search box the users listed will be reduced to only those that matches the search pattern.
Search patterns depend on the concrete security provider being used by the application.
By clicking on the "New user +" anchor, a form is displayed on the right.
This is a wizard like interface where the application asks for the new user name, a password as well as what roles/groups to assign.
Editing a user
After clicking on a user in the left sidebar, the user editor is opened on the screen's right.
For instance, the details screen for the admin user when using the Wildfly security provider looks like the following screenshot:
Same screen but when using the Keycloak security provider looks as:
Note that when using the Keycloak provider, a new user attributes section is displayed, but it's not present when using the Wildfly provider. This is due to the fact that the information and actions available always depend on each provider's capabilities as explained in the "Security provider capabilities" section below.
Next is the type of information handled in the user's details screen:
The user name
The user's attributes
The assigned groups
The assigned roles
The permissions granted or denied
In order to update or delete an existing user, click on the Edit button present near to the username in the user editor screen:
Once the editor is in edit mode, different operations can be done (provided the security provider supports
them):
For instance, to modify the set of roles and groups assigned to the user or to change the user's password as well.
Permissions summary
The Permissions tab shows a summary of all the permissions assigned to this particular user. This is a very helpful view as it allows administrator users to verify if a target user has the right permission levels according to the security settings of its roles and groups.
Further details about how to assign permissions to roles and groups are in the "Security Settings Editor" section below.
Updating the user's attributes
User attributes can added or deleted using the actions available in the attributes table:
Updating assigned groups
From the Groups tab, a group selection popup is presented when clicking on the "Add to groups" button:
This popup screen allows the user to search and select or deselect the groups assigned to the user.
Updating assigned roles
From the Roles tab, a role selection popup is presented when clicking on "Add to roles" button:
This popup screen allows the user to search and select or deselect the roles assigned to the user.
Changing the user's password
A change password popup screen is presented when clicking on the "Change password" button:
Deleting users
The user currently being edited can be deleted from the realm by clicking on the "Delete" button.
Security provider capabilities
Each security realm can provide support for different operations. For example, consider the use of a Wildfly's realm based on properties files. The contents for the applications-users.properties is like:
Notice that it's based on key-value pairs where the key is the user name, and the value is the hashed value for the user's password. So a user is just represented by a key and its user name, it does not have a name nor an address or any other meta information.
On the other hand, consider the use of a realm provided by a Keycloak server. The user information is composed by more meta-data, such as the surname, address, etc, as in the following image:
So the different services and client side components from the User and Group Management API are based on capabilities which are used to expose or restrict the available functionality provided by the different services and client side components. Examples of capabilities are:
Create a user
Update a user
Delete a user
Update user's attributes
Create a group
Update a group
Assign groups to a user
Assign roles to a user
Each security provider must specify a set of capabilities supported. From the previous examples, it is noted that the Wildfly security provider does not support the attributes management capability - the user is only composed by the user name. On the other hand the Keycloak provider does support this capability.
The different views and user interface components rely on the capabilities supported by each provider, so if a capability is not supported by the provider in use, the UI does not provide the views for the management of that capability. As an example, consider that a concrete provider does not support deleting users - the delete user button on the user interface will be not available.
Please take a look at the concrete service provider documentation to check all the supported capabilities for each one, the default ones can be found here.
Group management
By selecting the Groups tab in the left sidebar, the application shows all the groups present by default on the application's security realm:
Searching for groups
In addition to listing all the groups, search is also allowed. When specifying the search pattern in the search box the groups listed will be reduced to only those that matches the search pattern.
Search patterns depend on the concrete security provider being used by the application.
By clicking on the "New group +" anchor, a new screen will be presented on the center panel to perform a new group creation.
After typing a name and clicking Save, the next step is to assign users to it:
Clicking on the "Add selected users" button finishes the group creation.
Modifying a group
After clicking on a group in the left sidebar, the security settings editor for the selected group instance is opened on the screen's right. Further details at the "Security Settings Editor" section below.
Deleting groups
To delete an existing group just click on the Delete button.
Role management
By selecting the Roles tab in the left sidebar, the application shows all the application roles:
Unlike users and groups, roles can not be created nor deleted as they come from the application's web.xml descriptor. After clicking on a role in the left sidebar, the role editor is opened on the right, which is exactly the same security settings editor used for groups. Further details at the "Security Settings Editor" section.
That means both role and group based permissions can be defined. The main difference between roles and group are:
Roles are an application defined resource. They are defined as <security-role> entries in the application's web.xml descriptor.
Groups are dynamic and can be defined at runtime. The installed security provider determines where groups instances are stored.
They can be used together without any trouble. Groups are recommended though as they are a more flexible than roles.
Searching for roles
In addition to listing all the roles, search is also allowed. When specifying the search pattern in the search box the roles listed will be reduced to only those that matches the search pattern.
Search patterns depend on the concrete security provider being used by the application.
This editor is used to set several security settings for both roles and groups.
Home perspective
This is the perspective where the user is directed after login. This makes it possible to have different home pages for different users, since users can be assigned to
different roles or groups.
Priority
It is used to determine what settings (home perspective, permissions, ...) have precedence for those users with more that one role or group assigned.
Without this setting, it won't be possible to determine what role/group should take precedence. For instance, an administrative role has higher priority than a non-administrative one. For users with both administrative and non-administrative roles granted, administrative privileges will always win, provided the administrative role's priority is greater than the other.
Permissions
Currently, only perspective permissions are supported in the UI. If access to a perspective is denied then it will not be shown in any of application menus. Update, Delete and Create permissions change the behaviour of the perspective management plugin editor.
For perspectives, it is possible to define global permissions and add single instance exceptions afterwards. For instance, Read access can be granted to all the perspectives and deny access just to an individual perspective. This is called the grant all deny a few strategy.
The opposite, deny all grant a few strategy is also supported:
NOTE: In the example above, the Update and Delete permissions are disabled as it does not makes sense to define such permissions if the user is not even able to read perspectives.
Security Policy Storage
The security policy is stored under the workbench’s VFS. Most concrete, in a GIT repo called “security”.
The ACL table is stored in a file called “security-policy.properties” under the “authz” directory. Next is an example of the entries this file contains:
Every time the ACL is modified from the security settings UI the changes are stored into the GIT repo.
Initially, when the application is deployed for the first time there is no security policy stored in GIT. However, the application might need to set-up a default policy with the different access profiles for each of the application roles.
In order to support default policies the system allows for declaring a security policy as part of the webapp’s content. This can be done just by placing a security-policy.properties file under the webapp’s resource classpath (the WEB-INF/classes directory inside the WAR archive is a valid one). On app start-up the following steps are executed:
Check if an active policy is already stored in GIT
If not, then check if a policy has been defined under the webapp’s classpath
If found, such policy is stored under GIT
The above is an auto-deploy mechanism which is used in the workbench to set-up its default security policy.
One slight variation of the deployment process is the ability to split the “security-policy.properties” file into small pieces so that it is possible, for example, to define one file per role. The split files must start by the “security-module-” prefix, for instance: “security-module-admin.properties”. The deployment mechanism will read and deploy both the "security-policy.properties" and all the optional “security-module-?.properties” found on the classpath.
Notice, despite using the split approach, the “security-policy.properties” must always be present as it is used as a marker file by the security subsystem in order to locate the other policy files. This split mechanism allows for a better organization of the whole security policy.
Authorization API
Uberfire provides a complete API around permissions. The AuthorizationManager is the main interface for checking if permissions are granted to users.
@Inject
AuthorizationManager authzManager;

Perspective perpsective1;
User user;
...
boolean result = authzManager.authorize(perspective1, user);
The security check calls always use the permissions defined in the security policy.
For those interested in those APIs, an entire chapter can be found in the Uberfire's documentation.
Summary
The features described above bring even more flexibility to Dashbuilder. Users and groups can be created right from the UI, new assets like perspectives can be authored (the new Perspective editor is about to be released :-) ) and, finally, permissions on perspectives can be granted or denied.
In the future, along with the improvement of the authoring capabilities, more permission types will be added. The ultimate goal is to deliver a zero/low code, very flexible and customizable tooling which allows to develop, build and deploy business dashboards in the cloud.
UF Dasbuilder is close to its 1.0 release. Only a few major features like the filter controls or the perspective builder are still in progress. The next article will introduce the perspective builder which is the main component used for dashboard design. Stay tuned!
The Dashbuilder's Elastic Search Data Provider support has been upgraded to the latest Elastic version, so you can now create your dashboards consuming both Elastic Search 1.x or 2.x.
Now it is extremely easy to create your own data sets, data visualizations and dashboards from data located in any Elastic Search node. Just give it a try!
Getting into more technical details, this upgrade implies a complete internal refactoring of the connector and the endpoint consumer. This is due to the upgrade to Java 8 in current Dashbuilder version in master, which allows to get rid of the Jest client used to connect to the Elastic Search node and use the native Elastic's Java client instead. A lot of marshalling/parsing code has been removed and all the remote service communication is now delegated to the Elastic's client itself, which makes Dashbuilder's code cleaner and easy to manipulate and extend according your needs.
This article is about a new Dashbuilder's feature for consuming and visualizing data stored in an ElasticSearch server. ElasticSearch (aka ELS) is a noSQL storage, indexing & search service that provides a distributed, multitenant-capable full-text search engine with a RESTful web interface and schema-free JSON documents. If you want to learn more about it, please visit the ElasticSearch home page.
Dashbuilder is a web based tooling that eases the process of building dashboards . As you might know, Dashbuilder provides a simple API that allows to integrate with any external storage system: the Data Provider API. Since latest 0.3.0.Final release, Dashbuilder adds another data provider for the Elastic Search integration, along with the already existing CSV, SQL and Bean providers. This new one provider allows the users to consume unstructured data from an ElasticSearch server instance at real-time. So you can abstract the data stored in your ELS into a data set structure, and then use all the Data Set API features and power to create your visualizations, as can be done with any of the other data providers available.
The following sections will give you a quick overview of the ElasticSearch integration features. At the end of the article you will also find a tutorial that shows how easy is to integrate Dashbuilder with an ELS server, or as in this example, with the ELK stack, providing an step-by-step tutorial for the creation of a real-time system metrics dashboard. (You can skip the first part of this article if you are only interested following the the tutorial).
The tutorial's resulting dashboard
The ElasticSearch data provider
Overview
The main goal for the Elastic Search data provider is to consume unstructured data from an ELS index and generate a resulting structured data set, which can be used along the application to create your visualizations and dashboards.
Elastic Search Data Provider overview
As you can see, Dashbuilder communicates with the server instance using the RESTFul API provided by ElasticSearch. It allows an easy integration as the protocol used for the communication is the HTTP/JSON one, which has lots of already well known advantages, such as providing data in an easy and human readable structure, skipping the needs for firewall configurations, etc etc.
Key concepts
In order to consume data from an index stored in a ELS server, the data provider needs a set of mandatory attributes that describe where and how to find and consume it. These attributes are defined by the user and stored in a structure called Elasticsearch Data Set Definition. The minimal attributes to set in order to consume data from an ELS instance are:
Attribute
Example
Description
Server URL
http://localhost:9200
The server URL for your ELS RESTFul API services
Cluster name
elasticsearch
The name of the cluster in the server instance
Index
expensereports
The name of the index to consume
Type/s
expense
The document type/s to consume for the given index
Once a data set definition is created, Dashbuilder is able to process data lookup calls against the ELS instance and generate a resulting data set, so finally the users can create their visualizations and dashboards using the remote data.
Another important key point about turning ELS unstructured data into structured data sets are the data set columns. ElasticSearch provides its own core data types that are implicitly bind to data set columns by the ELS data provider.
Data columns binding from an index mappings
The data columns binding is done automatically by the application when creating a new ELS data set definition. It binds the field name, data type, format and patterns from an ELS index mappings into data set columns with a given name, data type, format and pattern as well.
This section is intended to be an a step-by-step tutorial that will show you how to define and consume data from an ELS server instance and use it to create your visualizations and dashboards from scratch.
As you will see in this tutorial, it's really easy to create data set definitions, visualizations and dashboards in Dashbuilder. This demo is intended for non-technical users, as there is no need for coding or having high level technical skills. In a few mouse clicks you will be consuming your ELS data and creating dashboards! :)
Let's see the scenario used for this tutorial and then we will deep into each workflow step for achieving a real-time system metrics dashboard.
Scenario
The main goal for the system metrics dashboard is to be able to consume and visualize different metrics that come from different computers at real-time.
For this tutorial we have used a well known system metrics reporting and storage environment provided by the collectd daemon and the ELK stack. We decided to use this scenario as it's really easy to setup and you can find lots of documents and articles on the net about it. The main difference with the other tutorials based on the ELK stack is the use of Dashbuilder as the monitoring web application instead of Kibana.
The following diagram describes the environment used in this tutorial:
System metrics scenario
As you can see, the scenario consists of:
Two computers to be monitored - Computer A & Computer B
The main server that provides:
An instance of Logstash server
An instance of an ElasticSearch server
The Dashbuilder application
A single client that consumes the dashboard/s
The overall workflow for this scenario follows these steps:
Collection and transmission of the system metrics Both computer A and computer B have the collectd service running, which captures some of the system metrics and send these ones over the local network using TCP and UDP packets
Process and storage of the system metrics The collectd resulting packets from both computers are processed by the Logstash server and sent to ElasticSearch, responsible for storing all the metrics data in a given index
Consume and visualize the system metrics Once the client that consumes the dashboard needs to retrieve some metric data, Dashbuilder application performs all the data look-up operations against the ELS storage server, producing the resulting data sets that feed your dashboards and visualizations.
NOTE: In this tutorial, the Logstash server has been configured to store the logs into an index named logstash-logs in the ELS instance, and is not the default one used by Logstash in a clean installation.
Once having this or a similar scenario, we are able to consume the computer metrics from the ElasticSearch server and benefit from all Dashbuilder's features.
Keep in mind that Dashbuilder only worries about the ELS server data, it does not care how metrics are collected, processed or transmitted. This means you can store the metrics in any storage supported by Dashbuilder.
Metrics data
Using collectd for generating the metrics provides a huge flexibility and power as it's really easy to install, configure and it supports lots of plugin and metrics. Consider that these metrics are captured by the Logstash server, which process and finally stores each one into the ELS server. So here is the list of fields in the generated logstash's index for each metric that will be consumed by the tutorial:
Field name
Description
@timestamp
The timestamp for the metric
host.raw
The hostname that produces the metric (the ".raw" indicates that we are using a multi-field for the host field in the index, for the logstash generated index, it contains the not_analyzed value of the hostname)
plugin
The metric plugin (cpu, memory, df, processes, interface)
plugin_instance
The instance for the metric for a given plugin
type_instance
The type for a given metric (cpu used, cpu free, etc)
value
Contains the concrete value for the given metric and type
rx
Contains the network packets received in the given interval
tx
Contains the network packets sent in the given interval
Let's deep into the step-by-step creation of the system metrics dashboard!
Step by step tutorial
Once described the environment and the metrics to be consumed, let's start the tutorial for creating a real-time system metrics dashboard using Dashbuilder.
The result of this tutorial is given by a simple three step workflow:
Considerations:
Dashbuilder web application running at http://localhost:8080/dashbuilder
ElasticSearch server RESTFul API available and running at http://localhost:9200
Consider the logstash for the ELS cluster name.
Consider logstash-logs as the index generated by logstash in the ELS server which contains all system metrics data
Step 1 - Create the data set definition
Let's create the definition for our metrics data set.
This tutorial describes just the minimal configuration required for generating a data set with all metrics stored in the ELS server's index. It does not deep into the use of data set filters, column types modifications or advanced attributes and features. Just try and play yourself with it! ;)
At Dashbuilder web application's home click on Authoring -> Data Set Authoring item on top menu:
Data set authoring menu item
Once at the data set authoring perspective, click on New data set button provided in the data set explorer view:
New data set button
On the center area of the data set authoring perspective appears a data set creation wizard. First step is to select the data provider type, for this tutorial select the ElasticSearch one and click on Next:
Data provider type selection screen
Next screen is the ElasticSearch data provider configuration, use the configuration values from your scenario and click on Test button:
Data provider configuration screen
At this point, the application is able to communicate with the ELS server and retrieve the mappings for the index and some preview values:
Data provider configuration and data set preview screen
At this screen you can add or remove the data set columns, modify their column types, specify an initial data set filter, and configure more advanced features at the Advanced tab.
As commented, this tutorial describes a minimal configuration for creating the data set definition, although is not the best implementation for real production usages.
Tips:
Just select the columns for your needs
Modify column types for your needs
Add initial filters when consuming the data set from several indicators
Consider data set refreshing
Do not create just one data set definition for your metrics indicators, create different ones for different metrics and hosts.
As for this tutorial, just click on Save button to store your data set definition and make it available for creating the dashboard's visualizations.
After save, you should see the new "All system metrics" data set definition in the explorer's list:
Data set explorer view
Now you can create new visualizations and dashboards using the All system metrics data set, let's go for it!
Step 2 - Create a dashboard
To create or navigate through the existing dashboards, use the Dashboards top menu item.
Click on Dashboards -> New dashboard:
Dashboards menu
And set a dashboard name on the popup screen:
New dashboard popup
Once a name is typed, press Ok and an empty dashboard appears.
At this point you can create as many displayers as you need, but before starting to create the displayers, you first should think about what you want and what you need.
For this tutorial consider the resulting dashboard's displayers and layout used as the following picture describes:
Displayers and layout for the dashboard
As you can see:
The dashboard will have 5 displayers
On left side it will have 3 metric displayers to show current memory, cpu and disk usage
On right side it will have an area chart (memory used in last minute) and a pie chart displayer (to show the current servers that are up and running)
All displayers will have the refresh feature enabled, using a one second interval, in order to display the real-time metrics
All displayers will show the average value for each metric, as several hosts can be present at same time
As you will see in the video, the metrics in real environments usually come with some delay produced by network latency, processing times, etc. So all displayers have atime frame filter to avoid this latency on the charts - for this environment we chose a time frame as:
now -7second till now -3second
Considering a maximum delay of 3 seconds for the metrics, and showing last 4 seconds of data for each one.
Next section describes how to use this popup for creating several displayers and have them created in your dashboard, so keep reading! ;)
Step 3 - Create the visualizations
This section explains how to create the displayers for this concrete dashboard, but it does not deep into details about the displayer editor popup and its usage, as this component has been already explained in this previous article.
In order to create a new displayer just click on the New displayer button on right side of the top menu:
New displayer button
The displayer editor popup appears as:
Displayer editor popup
This screen has three tabs, in order to configure the displayer type, the source data and other display related properties.
Displayer 1 - Memory usage metric displayer
Let's create our first displayer - a memory usage metric displayer using the following configuration:
Memory usage metric displayer configuration
On tab type, select type Metric
On tab data, specify the just new created "All system metrics" data set and add the filters (see the above diagram). The filter configuration should look like this:
Filter configuration
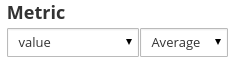
On same tab data, set the metric to display using an average function as:
Data set column to display using the avg function
Move to display tab and set a title for the chart:
Displayer title
In order to display the value in Gb, go to the Columns section and use the following values for the column attributes:
Column configuration
NOTE: For the expression attribute use value / 109 , and for the pattern attribute use #.## in order to show the input values in Gbytes
On same display tab, open the refresh section and enable it using a 1second interval:
Refresh data every second
Once the configuration is finished just click the Ok button and the new displayer will be dropped into the dashboard layout:
Memory used metric displayer
As you can see, you can create as many displayers as needed and drag&drop them into different dashboard areas. Just click the mouse-left button on the displayer panels's header and drag&drop it into the desired layout's region, when the compass control appears:
Move your displayers inside the dashboard
For the next dashboard's displayers, the creation workflow is similar, but just applying the different values on filters and columns. Here is the quick summary of their configuration:
Displayer 2 - CPU usage metric displayer
1.- Apply filters and columns values as:
CPU usage metric displayer configuration
2.- Set a title for the chart and enable the refresh feature using an interval of 1second
3.- There is no need to change column patterns as the values already are in percentage format
Displayer 3 - Free disk space metric displayer
1.- Apply filters and columns values as:
Free disk space metric displayer configuration
2.- Set a title for the chart and enable the refresh feature using an interval of 1second
3.- Apply same column configuration (expression & pattern) as the displayer 1.
Displayer 4 - Memory usage displayer using an area chart
1.- Apply filters and columns values as:
Memory usage area chart configuration
2.- Set a title for the chart and enable the refresh feature using an interval of 1second
3.- Apply same column configuration (expression & pattern) as the displayer 1.
Displayer 5 - Servers pie chart
1.- Apply filters and columns values as:
Server pie chart configuration
2.- Set a title for the chart and enable the refresh feature using an interval of 1second
Video
In order to show the system metrics dashboard in action, here there is quick video that shows how to create some displayers, apply the configurations and move them inside the dashboard areas for generating the final layout.
The environment used for this tutorial was:
Environemnt used for the tutorial
Also consider that the metrics data is coming from two different servers (under our control), so we can start, stop and stress them producing the real-time data being monitored by the dashboard.
To avoid long videos it starts with the data set definition, the dashboard and some displayers already created and configured.