Tuesday, March 31, 2015

UF Dashbuilder - Export displayer data to CSV and Excel


Displayer data export demo (select HD)


In short video demo above we demonstrate an interesting new feature that we've just added to dashbuilder, nl. the ability to export a displayer's data set, either to comma-separated-value format, or to excel format. While this is perhaps not a visually very impacting feature, it's without a doubt a very useful one.

The first important thing worth mentioning is the fact that this export can be applied to any type of displayer. In the end a displayer is in fact nothing more than a visual representation of some sort of underlying tabular data, so this is actually quite straightforward.

In the demo we can see a couple of displayers based on some example sales opportunities data. To the left we have a bar chart displayer representing some opportunities by their current pipeline status, and to the right a table displayer with more detailed information about the these sales opportunities. How to create and configure dashbuilder displayers was covered in a previous entry: UF Dashbuilder Displayer Editor & API.

In the first part of the demo you can see how the data export feature can be activated. To do that we have to go to the displayer's actions dropdown and select edit. In the displayer's edit popup window we then move to the display tab where its appearance properties are configured and here, if we open up the 'general' section, we can see 2 new checkboxes have been added for data export, either to csv and/or to excel format. Initially, these checkboxes are set to off, which means that the creator of a displayer has to explicitely enable data export for a specific displayer.

In the demo, a different type of export is chosen for each displayer, and when we return to normal view mode and revisit the actions dropdown, we can see how the new export action has now become now available to us. It's really as simple as that.

The next part of the demo shows how, and this is an important detail, the exported data concerns the currently visualized displayer window, i.e. if the displayer is subject to filtering, as is clearly seen in the demo, the exported data will be filtered accordingly.

That's all, we hope you find this feature useful, please don't hesitate to get back to us with any feedback!

Friday, March 27, 2015

UF Dashbuilder - Real time dashboards

   Dashboard solutions face different scenarios when it comes to data retrieval. While some dashboards do not require frequent updates as the data doesn't change very often or even rarely, other dashboards may require constant updates, because its data changes at a very fast pace. Therefore, we can classify our dashboards into two main groups:

  • Analitics: usually focused on the analysis of information about the past (historical/statistics), or about information that is known in advance (forecasts). The main trait of these dashboards is that data does not change very often and the time frame is usually long. Some examples: A company's sales evolution and forecast, sport statistics in general, etc.

  • Real time: their main trait is that data changes at a very fast pace. Therefore, this requires to update the indicators & reflect the changes in the UI frequently. Usually, the data is bound to a very short time frame, such as the last 10 seconds. Real time dashboards are typically used to monitor critical resources or systems, for example: Health display sensors, IT resources, air traffic control, etc. 

   Here is a comparison table which summarizes the main features of both:

    Analytics  Real-time  
 Data changes very often                                No Yes   
 Time frame    Any  Short   
 Amount of information    Any  Little   
 Dashboard updates  Rarely  Frequent   


  Dashbuilder is a general purpose dashboard solution. One of its design goals is to support both approaches. The following video shows an example of a real time dashboard built using the Dashbuilder GWT Client API (do not forget to select HD). The dashboard contains some metrics about an emulated cluster (the values shown are not real).


Real time dashboard example

   The dashboard is part of the Dashbuilder examples gallery and it's basically a GWT UI binder widget (source code here).

   Not only we allow for creating programmatic dashboards but also for custom ones created by end users. The next video (select HD) is a demo of how to create a real-time dashboard from scratch using the tooling. Here again, we're using the emulated cluster metrics data set, so the values shown are not real.

Creating a real-time dashboard

    As you can see, Dashbuilder covers a wide range of scenarios. As we introduced in this blog entry, data can be extracted from different systems. Once you have the data you can easily create your own visualizations. Both the analytics and real-time approaches are supported out of the box.


Friday, March 20, 2015

UF Dashbuilder - Metric visualizations

  A metric is a very useful type of visualization for displaying a single value for a given data property. For example:

  • The number of running processes in a server, memory used, CPU load, I/O throughput, etc...
  • The number of tweets received last week
  • The total travel expenses in a company
   The next screenshot shows a sample dashboard using the new metric visualization recently added to Dashbuilder. 


Sales dashboard example

   The entire dashboard is consuming the same data set, although every displayer has been configured with the proper settings. Next, we are going to see how those metrics indicators can be created using the tooling.

 Metric displayer

   As you can see below, a new "Metric" visualization type has been added to the Displayer Editor.

Displayer editor - Metric visualization type
Displayer editor - Metric visualization type 


   Once the "Metric" option has been selected, next step is to configure the data retrieval (see below, the "Data" tab). From this tab we need to:

  1. Select the source data set. In this case we have chosen the "Sales opportunities" example, which is a Java Bean generated data set containing the sales of a virtual company from the last 2 years until 3 years in the future.
  2. Select the metric to display. In this case we have selected the total sum of the opportunities closed within the current company's fiscal year. To do so, from the "Filters" section, we have added a filter on the property "closingDate". 


Metric displayer configuration

   After configuring the data retrieval, the last step is to adjust the "Display" settings. First of all, the metric needs a title. Secondly, the metric format can also be adjusted. There are 2 settings involved:

Expression

    It's a mathematical operation applied to the value retrieved from the data set. In our case, we are using "value/1000" as we want to display thousand dollars. Thousands are easier to understand by end users as sales amounts are usually big figures.
 
   We can combine the most common mathematical operators:
   
              *  => Multiply
              /   => Divide
              +  => Add
              -   => Subtract

   For example: 
  • "value*1.21"  => Amount plus 21% tax"
   Actually, we can use any valid JavaScript expression. For instance, "Math.sqrt(value)", square root, is also valid.

Pattern

   It's used to format the value obtained after applying the above expression. In our case we want to use the "$" currency symbol together with the "K" suffix as we want to indicate the value displayed is formatted in thousand dollars. f.i: "$ 10,345.23 K".  Pattern expressions are based on the default Java notation format for numbers. Some examples:

  • "#,###"            => "10,300"            no decimal part
  • "$#,###.##"     => "$10,300.45"     decimal part, currency symbol
  • "000000.000"  => "010300.453"    leading and trailing zeros, no commas


   That's all for today. As you can see, in Dashbuilder, has never been so easy to create & configure metrics visualizations on top of your data. Thanks for reading and stay tuned!


Tuesday, March 10, 2015

UF Dashbuilder - Activity monitoring in jBPM

   Last week, the jBPM team announced the 6.2.0.Final release (announcement here). In this release (like in previous ones) you can author processes, rules, data models, forms and all the assets of a BPM project. You can also create or clone existing projects from remote GIT repositories and group such repositories into different organizational units. Everything can be done from the jBPM authoring console (aka KIE Workbench), a unified UI built using the Uberfire framework & GWT.

   In this latest release, they have also added a new perspective to monitor the activity of the source GIT repositories and organizational units managed by the tooling (see screenshot below). The perspective itself it's just a dashboard displaying several indicators about the commit activity. From the dashboard controls it is possible to:

  • Show the overall activity on our repositories
  • Select a single organizational unit or repository
  • List the top contributors
  • Show only the activity for an specific time frame

  In this video you can see the dashboard in action (do not forget to select HD).

Contributors Perspective

  Organizational units can be managed from the menu Authoring>Administration>Organizational Units. Every time an organizational unit is added or removed the dashboard is updated.

Administration - Organizational Units 

   Likewise, from the Authoring>Administration>Repositories view we can create, clone or delete repositories. The dashboard will always feed from the list of repositories available.

Administration - Repositories


   As shown, activity monitoring in jBPM can be applied not only to the processes business domain but also to the authoring lifecycle in order the get a detailed view of the ongoing development activities.

How it's made


The following diagram shows the overall design of the dashboard architecture. Components in grey are platform components, blue ones are specific to the contributors dashboard.

Contributors dashboard architecture

  These are the steps the backend components take to build the contributors data set:

  • The ContributorsManager asks the platform services for the set of available org. units & repos. 
  • Once it has such information, it builds a data set containing the commit activity.
  • The contributors dataset is registered into the Dashbuilder's DataSetManager.

   All the steps above are executed on application start up time. Once running, the ContributorsManager also receives notifications form the platform services about any changes on the org. units & repositories registered, so that the contributors data set is synced up accordingly. 


   From the UI perspective, the jBPM's contributors dashboard is an example of a hard-coded dashboard built using the Dashbuilder Displayer API, which was introduced in this previous blog entry. The ContributorsDashboard component is just a GWT composite widget containing several Displayer instances feeding from the contributors data set.

   (The source code of the contributors perspective can be found here)


    This has been a good example of how to leverage the Dashbuilder technology to build activity monitoring dashboards. In the future, we plan for applying the technology in other areas within jBPM, like, for instance, an improved version of the jBPM process dashboard. We will keep you posted!

Thursday, March 5, 2015

Dashbuilder 6.2.0 released

The 6.2.0 Final release is available for download in the dashbuilder.org website.


  • Improved import/export support for unattended dashboard deployment. This allows for automating the movement of dashboards between different environments (dev/test/prod). Further details in the following 6.2.0 book's chapter
  • Added support for Weblogic 12c and Sybase DB (ASE 15.7) 

Tuesday, March 3, 2015

UF Dashbuilder - Rendering Subsystem

   More and more data is being collected nowadays, but collecting lots of data does not make any sense until these data can be extracted, analyzed and interpreted to make it understandable for business people. Data visualization is one of the key points of this process: data visualization is the presentation of data in a pictorial or graphical format. There exist several ways of displaying and representing these data such as tables or charts.

Data visualization software is wide extended in the market, there exist lots of libraries that provides the ability to create data tables and all kind of charts. Some of them are proprietary, some open source, some provides specific graphs and others are designed to be used in specific scenarios.

In Dashbuilder, we think the best approach is to be able to adapt to any of those libraries easily. It allows the developer to use all the power of the Dashbuilder's data set API and display the data as user expects, using different data visualization components from different libraries that can be adapted to every situation.

These visualization components that integrate the visualization libraries with Dashbuilder Data Set API are called Displayers. Dashbuilder provides by default some displayer components, such as the Google bar, pie and table displayers, or the Lienzo bar chart displayer, among others.

Another concept that comes into play is the Renderer Library:  a Dashbuilder component that allows the framework to use any third party data visualization library. It allows the communication between data set API and the way how data is visualized. The goal of a renderer is to provide a Displayer for each of the visualizations supported.

As you can see, data visualization is the last stage in business data analysis; as it's what the end user will see and use to take business decisions. So it's very important to talk about how Dashbuilder renders the data and how it adapts to any situation by integrating and handling third party data visualization libraries.

This article explains the internals of the Dashbuilder rendering subsystem, its architecture and the design of the different components and interfaces involved.


The rendering subsystem

   The rendering subsystem in Dashbuilder is the responsible for generating the different kinds of visualization components, such as bar charts, pie charts, area charts, bubble charts, tables, maps and so on.

These are some examples of visualization components provided by default:

GWT Bar and Pie Charts


The main advantage of the rendering subsystem is that it's not tied to any visualization library, as it provides a pluggable mechanism in order to use your favorite one.

Data visualization libraries are pluggable. What does that mean?


   Dashbuilder is a data visualization framework that provides the ability to query, collect and organize your business data, but its goal is not focused in developing and providing data visualization components on the client side; it just provides the grouped, filtered an sorted data to use in those visualization components, that can be provided by any third party data visualization library.

Summarizing, the rendering subsystem provides a pluggable mechanism that connects the data set API with a data visualization component, and it allows to use any third party library to visualize it. 

This external data visualization mechanism is represented by the  RendererLibrary interface and managed by the RendererLibLocator as you can see in the following diagram: 

Renderer subsystem main interfaces

As an example, consider the following two charts. Both display the same chart type and same data but using different data visualization libraries: GWT and Lienzo:

Bar Chart - Lienzo vs GWT


Renderer Library

   A RendererLibrary is a component that displays the data using an specific visualization library. Its main goal is to provide a data Displayer component for each visualization component the visualization library provides.

For example, consider the GWT charting library. As it provides a bar chart, the Dashbulder's Google Renderer library will provide the GoogleBarChartDisplayer. As it provides a pie chart, the Dashbulder's Google Renderer library will provide the PieBarChartDisplayer. And make it extensible for all kind of GWT charts.

The following UML diagram shows an example of a RendererLibrary implementation for Google GWT charting.

In this example, the renderer implementation class is GoogleRenderer (implements Renderer interface) and it provides a GoogleDisplayer based class (implements Displayer interface). Note that GoogleDisplayer class extends some other abstract Google base classes, but it's up to the developer the architecture for it. Dashbuilder just requires to implmenent the Displayer interface for drawing the component.

Google Renderer & Displayer classes diagram

As you can see in the diagram above, each RendererLibrary has a unique identifier. But as most important, a RendererLibrary component must provide two methods: draw and redrawwhich are used by the framework as: draw method to init & render the visualization for the first time, and redraw to get and display the latest data changes.

It's important to note that each third party data visualization library can provide custom functionality and custom settings for a visualization component that are not present in the same component from another library.

For those interested in developing a new renderer, please just take a look at the current implementations of the  GoogleRenderer and LienzoRenderer in GitHub.

Available rendering libraries

   Dashbuilder supports by default:
  • GWT - Data visualization library that provides several chart types that are build using the popular GWT framework. Provided by Google.

    The project is located at Google Code and you can find the gallery here.
  • Lienzo  - Data visualization library that  it's still a prototype under development and not ready to be used in production environments. It provides, at this stage, two chart types: bar & pie. It's tight integrated with Dashbuilder and will provide extended functionality. Keep updated on it!

    Note that it's Open Source and distributed by Ahomé Innovation Technologies.

    The project is located at GitHub and you can find the gallery here.
      
These are the visualization components supported by each Rendering Library:

Renderer LibraryBar ChartPie ChartArea ChartLine ChartBubble ChartMeter ChartTableMap
GWTXXXXXXXX
Lienzo XX------

IMPORTANT: In future releases we will integrate new renderer libraries in order to support other visualization frameworks such as D3. Stay tuned!


The rendering process

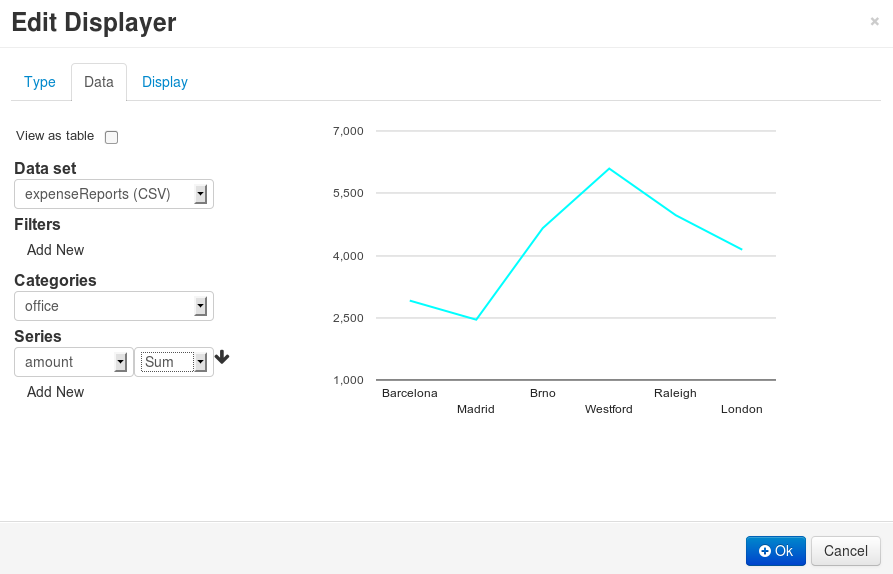
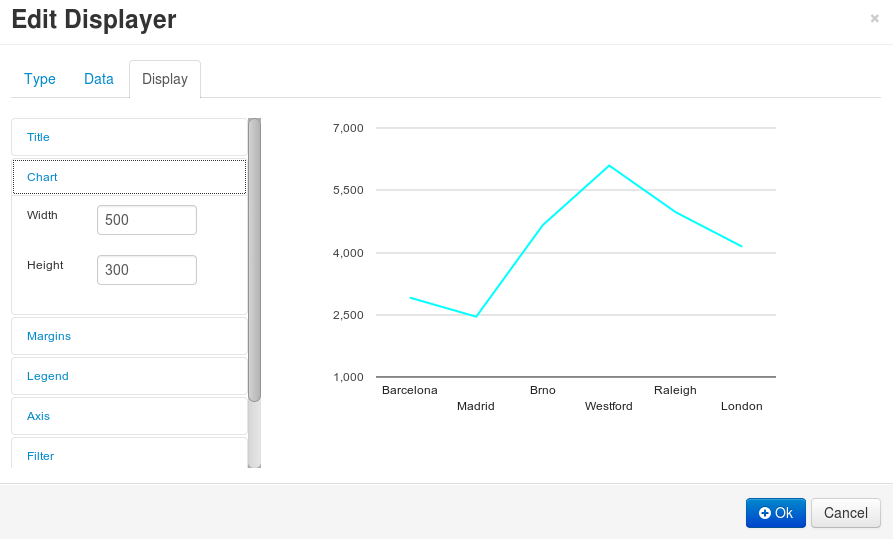
   Once your are familiarized with the basic components in Dashbuilder, let's explain how the rendering process works. Rendering is the process of generating a component or an image from a given model by a computer program. In Dashbuilder, the rendering process allows for getting & draw a Displayer instance from a given DisplayerSettings configuration.

In the previous article, we talked about Displayers and how to create them. Now we are going to give some insights about the internals, and how Dashbuilder uses the renderer libraries to create & draw a  Displayer.

The rendering process implies:
  • To perform a data set look up
Given a data set (looked up from an external system) the users want to display the data in a certain way, by performing operations on it, such as grouping, filtering or sorting. This is the initial step to achieve data visualization: collect and organize your business data in a concrete way that will allow the business decision maker to analyze and interpret it. (In this previous article you can get all the details about the data set lookup process).
  • To provide the settings for the data visualization component that will display the information
At this point, the data is already collected and organized, next step is to decide which data visualization library to use and configure it for your purposes.
  • To obtain a Displayer component from Renderer class
Once data set is collected, organized and the user have decided & configured the data visualization library to use, next step is to obtain the Displayer component that matches all these requirements. This displayer is provided by the renderer class.
  • To draw the data visualization component (draw the Displayer instance)
Having the Displayer component instance it's time to show the data visualization component to the end user. To achieve that goal the Displayer component provides two methods: draw and redraw.

Rendering process in action

Next lines gets you into a deep detail in Dashbuilder architecture and how component interact to achieve the rendering process.

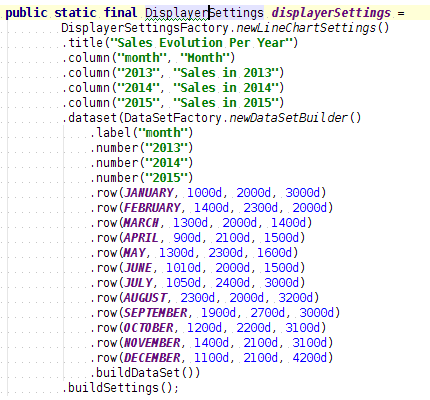
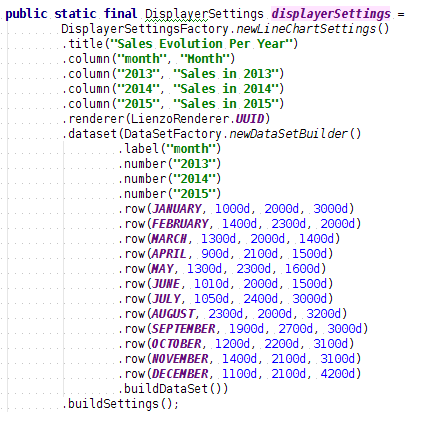
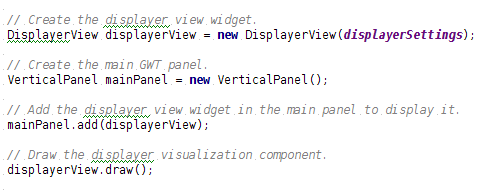
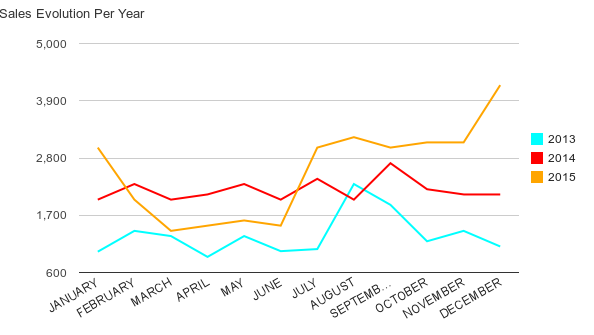
Consider your are creating a view (MyView) with a bar chart component using Dashbuilder. Your view source code would be similar to:

Example of view that uses a Bar Chart Displayer

The following diagram shows the sequence of calls between all the components involved during this bar chart displayer creation:


Displayer lookup sequence diagram
  1.  Build the settings for your Displayer component that will be used to show the bar chart.
     
    1. Build the displayerSettings instance from the factory methods that provide DisplayerSettingsFactory
       
    2. The settings instance contains the data set look up, the renderer library to use, the data visualization component to render and its settings
        
  2. Build a DisplayerHelper instance and use it to show the component (see init method)
     
    1. Obtain the Displayer component instance for your settings.
        
      1. Use the helper class DisplayerHelper to perform a displayer look up by using the method lookupDisplayer.  As you can see, to look up a displayer you have to provide the settings as method argument.
          
      2. DisplayerHelper delegates the look up of the displayer to the DisplayerLocator class and uses the returned instance to apply other configurations.
          
      3. The DisplayerLocator uses the RendererLibLocator component to locate the data visualization component specified by the settings instance. It's done by calling the method lookupRenderer. The result is a RendererLibrary instance, that is the responsible to provide a Displayer component that will display the data by using the settings provided.
          
    2. Use Displayer component API methods to draw the data visualization component.
        
      1. Once we have a Displayer component instance that matches our settings, it's time to draw the data visualization component, in this case, the bar chart.
          
      2. The DisplayerHelper class provides a method for showing the data visualization component: draw. This method takes the Displayer instance as argument and perform all the operation to draw the chart.
          
      3. Note that DisplayerHelper delegates the draw logic to the RendererLib instance, as it's each renderer library the responsible to draw the data in a certain way and using a certain library.

Conclusion


Data visualization is one of the most important aspects in any data analysis software, it provides an understandable way to analyze your business data.

In Dashbuilder we don't want to force end users to see and analyze all kind of data in the same way, we don't want to be tied or focused to an specific data visualization component, as depending on the nature of the data, a different visualization technique or library could be required.

For those reasons we think the best approach is to provide a rendering subsystem that can be integrated with any third party data visualization library, as it provides an extensible and scalable way to analyze and display your business data!

UF Dashbuilder Displayer Editor & API

  In the previous article, we introduced the data set API and how to perform data set look ups. Next step is to visualize this data set in a graphical way. So translating that into Dashbuilder language: to create a Displayer. A Displayer is a component responsible for rendering a data visualization component such as a bar chart, pie chart, tables, etc. This article explains how you can create a displayer to visualize your data. 

There exist two methods:


  • The Data Displayer UI Editor

    This is a UI component used to configure all the data set look up, displayer settings and other stuff. Can be used to create, update or remove data displayers at runtime.
  • The Dashbuilder's Displayer API

    Instead of creating the displayer at runtime using the UI, you can create displayers at compile time using the Dashbuilder's API.   


Creating a displayer from the UI

You can create, update or remove displayers at runtime using the Displayer Editor. This is the initial screen of this component:


Data Displayer Editor component

As you can see, there exist three main tabs:
  • Types tab - Allows to select the displayer type, such as bar chart, pie chart, table, etc.
      
  • Data tab - Allows to configure the data set look up for that displayer in order to fetch the data that will be displayed.
      
  • Display tab - Allows to select a renderer and configure the settings for the displayer type selected. the set of settings available varies depending on the displayer type and renderer selected.
So the steps to create or update a displayer are:


  • Choose the desired visualization type from the type tab. In this example. a Line Chart is selected.


Data Displayer Editor - Type tab


  • Click on the Data tab and configure the data lookup settings.


Data Displayer Editor - Data tab
    • First step is to select a Data Set instance. In that case we are using the expenseReports data set.
       
    • You can filter the data set rows by adding filters in the Filters section.
       
    • Select the categories property for the Line chart, in this case, the office data property.
       
    • Add the series for the Line chart: the property and the function to apply. In this example, we are using the sum function to calculate the amount per office.
  • Click on Display tab to configure the display settings.


Data Displayer Editor - Display tab

In this tab you have all the displayer settings available for the displayer type selected. Here you can configure the chart position, chart size, chart title, axis titles, margins, legend, tooltips and much more.

Another interesting setting is the renderer selector. It allows to change the RendererLibrary for type of chart. For example, we can switch from GWT to Lienzo charts by just changing the selector value:

Renderer selector
Note that this selector only appears when there exist more than one renderer for the selected displayer type.

  • Once the type, the data lookup and display settings are configured, just click the OK button to see the results. The chart is rendered according the set of settings defined:


Displayer built using Data Displayer Editor in the UI


    Creating a chart using the Displayer API

    You can also use the Dashbuilder's API to create a Displayer instance. Basically, the first step is to create a DisplayerSettings instance and use this instance to lookup a Displayer instance that will show the data visualization component. Next screenshot is an example of a DisplayerSettings used to build a Line chart with a data set that contains the sales evolution per year:


    DisplayerSettings creating using Dashbuilder's API

    From the code above:

    1. Use of DisplayerSettingsFactory to create a DisplayerSettings instance for a displayer type, in this example, a line chart.
        
    2. Configure the Displayer configuration parameters such as title, columns, filters and so on. Several API methods are available in the DisplayerSettings interface: title, columns, filters, renderer, sort operations, grouping, etc.
       
    3. Configure a DataSetLookup.
       
      1. You can create a new data set inline as in the example by using the DataSetFactory component.
         
      2. You can use an existing data set by specifying its UUID (the data set must have been previously deployed or created using the UI).
         
    4. Last step is to call the buildSettings method from DisplayerSettingsFactory. It provides the DisplayerSettings instance for your settings. 
    If you want to use a concrete RendererLibrary for rendering the displayer, you can use the renderer method from DisplayerSettings as:

    Using a concrete renderer via API
                       
    Once you have the DisplayerSettings instance built you can use the DisplayerHelper class to visualize your displayer in your view page. As easy as follows:
    Creating your view
      As you can see, the constructor for the DisplayerView helper class requires the DisplayerSettings instance previously built and it can be added in any GWT panel, as it's considered a composite GWT widget.

    Once DisplayerHelper widget instance is created and added into your view panels, you can use the draw method to display it. 

    Finally your view look like:
    Displayer created using Dashbuilder's API
    and.... that's all! :-). For those interested in the API details, please take a look at the Dashbuilder gallery which contains more examples of how to build displayer instances using the API - Gallery examples.